Premise
Our first Stimulus challenge is here! 🎉
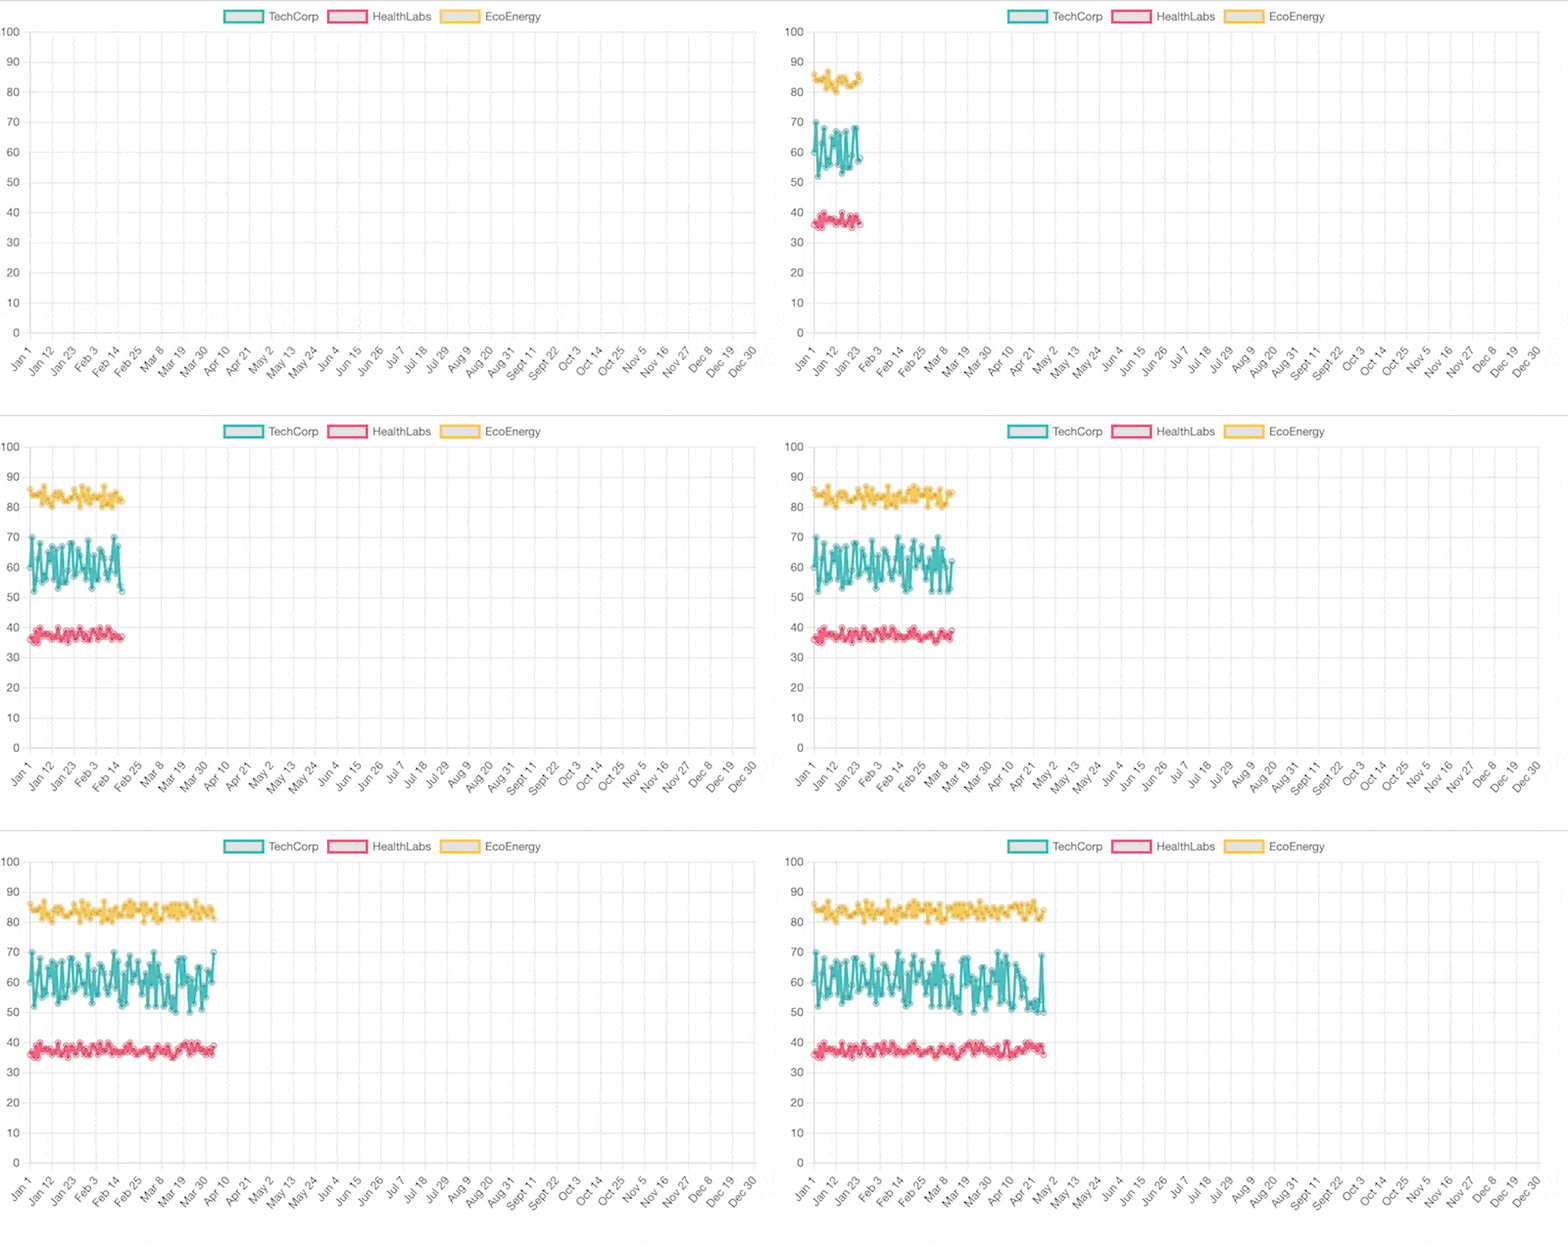
Turbo equips us with a ton of functionality to simplify our DOM mutating actions, but when 3rd party libraries come into the picture, it gets complicated. In our example here, we have a chart powered by chart.js displaying the prices of three imaginary stocks.
That is, at the moment they don’t display anything 🤯
Challenge
Our chart controller receives continuous price updates via a stimulus value called stockPrices. This value contains stock prices in a plain object of the following structure:
{
  TechCorp: [...],
  HealthLabs: [...],
  EcoEnergy: [...]
}
In the connect callback, our controller is already initialized with the correct chart configuration: https://stackblitz.com/edit/stimulus-value-changed-callbacks?file=controllers%2Fchart_controller.js%3AL18
Your task is to react to the incoming price changes by updating the charge in the corresponding value change listener here: https://stackblitz.com/edit/stimulus-value-changed-callbacks?file=controllers%2Fchart_controller.js%3AL53
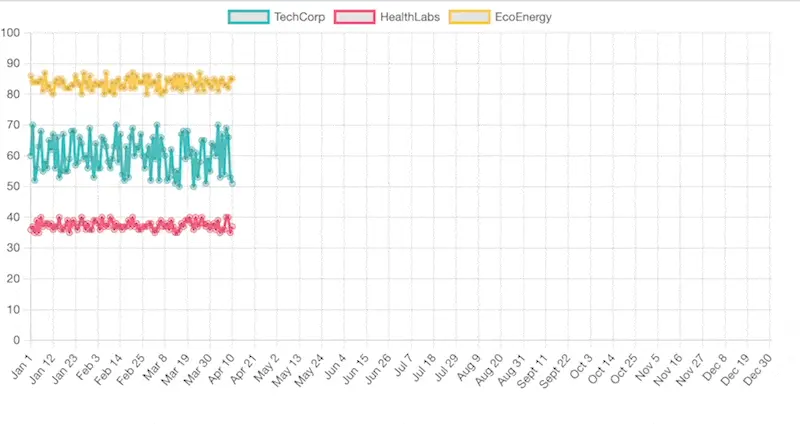
This is what the end result should look like:

Caveats
The default animation is quite annoying, in my opinion. You might want to switch it off.
Teaser
Can you spice this up with animations? For example, the “progressive line with easing” example looks interesting.


